Just how unequal is your state, city and county? How much of your community’s income growth is flowing to the one percent?
A new report, published by the Economic Policy Institute (EPI), examines the share of income growth that flows to the wealthiest one percent in a number of jurisdictions.
For the first time, the report documents income inequality at the city and county level, examining 916 metropolitan areas and over 3,000 counties.
We’ve known from previous research that since the Great Recession of 2009, the lion’s share of income gains has gone to the richest one percent. The EPI report reveals that between 2009 and 2013, the top one percent captured 85.1 percent of total income growth in the U.S.
In 2013, the top one percent of households nationally made 25.3 times as much as the bottom 99 percent. Remember, this is the average income for everyone else, simply removing the incomes of the 1 percent. The gap between the top one percent and the bottom 20 percent is much more extreme.
Some states are more unequal than others. Nine states – including New York, Connecticut, and Wyoming – have gaps that exceed 40 to one between the top one percent and the bottom 99 percent.
Accompanying the report is a state-by-state online interactive resource to look up your state or region. A curious reader can look up the average income of the top one percent in their state and the amount of income they’d need to join the one percent. It also includes a 1-to-99 ratio of income.
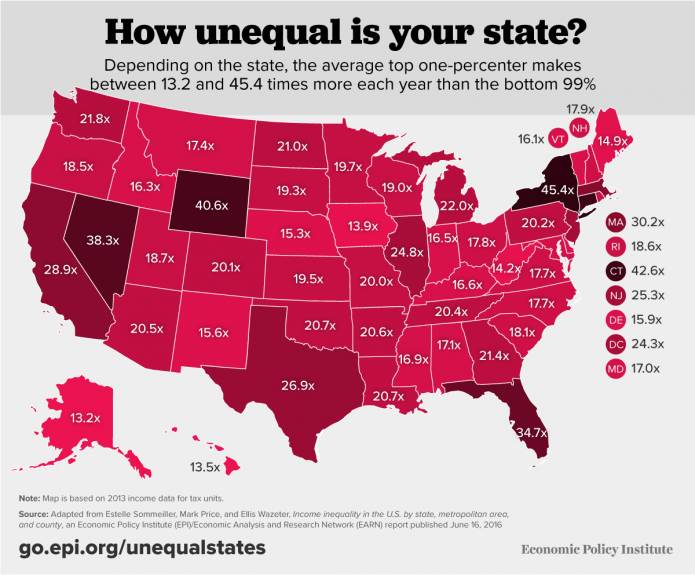
(Economic Policy Institute)
In New York State, for example, you’d need to earn over $517,557 to be in the one percent. The average income of this wealthiest one percent is $2,006,632. Meanwhile, the average income of everyone else is $44, 163. The Empire State’s wealthiest one percent makes 45.4 times more than its bottom 99 percent.
In my home state of Michigan, the one percent, with average incomes of $834,008, have 22 times more income than the bottom 99 percent, averaging $37,896.
Within Michigan, Charlevoix County, a northern area hugging the shores of Lake Michigan, is the most unequal county in the state, with the one percent having 30.9 times more income than the bottom 99 percent.
The most unequal county in the U.S. is Teton, Wyoming, home to the billionaire sanctuary of Jackson Hole. In Teton, the average income of the one percent is a whopping $28.1 million, over 233 times the average incomes of everyone else.
The most relatively equal county in the U.S. is Wade Hampton, Alaska where the ibe percent has an average income of just under $150,000, only 5.1 times the average income of those in 99 percent (An interesting aside – in 2015 the residents of Wade Hampton changed their name to Kusilvak Census area, dropping the name of a South Carolina slave owner who never set foot in their region).
The paper, “Income inequality in the US by state, metropolitan area, and county,” is published by EPI for the Economic Analysis and Research Network (EARN). The two principal authors are Mark Price, an economist at the Keystone Research Center in Harrisburg, PA., and Estelle Sommeiller, a socio-economist at the Institute for Research in Economic and Social Sciences in Greater Paris France.